Emotion classification multiclass example
This notebook demonstrates how to use the Partition
Using custom data configuration default
Reusing dataset emotion (/home/slundberg/.cache/huggingface/datasets/emotion/default/0.0.0/aa34462255cd487d04be8387a2d572588f6ceee23f784f37365aa714afeb8fe6)
Create an explainer for the pipeline
A transformers pipeline object can be passed directly to shap.Explainer shap.models.TransformersPipeline shap.maskers.Text
Compute SHAP values
Explainers have the same method signature as the models they are explaining, so we just pass a list of strings for which to explain the classifications.
Visualize the impact on all the output classes
In the plots below, when you hover your mouse over an output class you get the explanation for that output class. When you click an output class name then that class remains the focus of the explanation visualization until you click another class.
The base value is what the model outputs when the entire input text is masked, while \(f_{output class}(inputs)\) is the output of the model for the full original input. The SHAP values explain in an addive way how the impact of unmasking each word changes the model output from the base value (where the entire input is masked) to the final prediction value.
outputs
sadness
joy
love
anger
fear
surprise
0.3 0.1 -0.1 -0.3 0.5 0.7 0.9 0.131672 0.131672 base value 0.996408 0.996408 fsadness (inputs) 0.855 humiliated 0.009 didn 0.003 i 0.001 t 0.0 -0.004 feel -0.0 0.6 0.5 0.4 0.3 0.2 0.7 0.8 0.9 1 0.131672 0.131672 base value 0.996408 0.996408 fsadness (inputs) 0.855 humiliated 0.009 didn 0.003 i 0.001 t 0.0 -0.004 feel -0.0 0.3 0.1 -0.1 -0.3 0.5 0.7 0.9 0.222778 0.222778 base value 0.000680704 0.000680704 fjoy (inputs) 0.178 feel 0.008 t 0.0 0.0 -0.395 humiliated -0.009 i -0.004 didn 0.1 0 -0.1 0.2 0.3 0.4 0.222778 0.222778 base value 0.000680704 0.000680704 fjoy (inputs) 0.178 feel 0.008 t 0.0 0.0 -0.395 humiliated -0.009 i -0.004 didn 0.3 0.1 -0.1 -0.3 0.5 0.7 0.9 0.106714 0.106714 base value 0.000649004 0.000649004 flove (inputs) -0.076 humiliated -0.014 didn -0.008 i -0.007 t -0.001 feel -0.0 -0.0 0.05 0.03 0.01 0.07 0.09 0.106714 0.106714 base value 0.000649004 0.000649004 flove (inputs) -0.076 humiliated -0.014 didn -0.008 i -0.007 t -0.001 feel -0.0 -0.0 0.3 0.1 -0.1 -0.3 0.5 0.7 0.9 0.278915 0.278915 base value 0.00123321 0.00123321 fanger (inputs) 0.028 didn 0.015 i 0.008 t -0.199 humiliated -0.13 feel -0.0 -0.0 0.1 0 0.2 0.3 0.278915 0.278915 base value 0.00123321 0.00123321 fanger (inputs) 0.028 didn 0.015 i 0.008 t -0.199 humiliated -0.13 feel -0.0 -0.0 0.3 0.1 -0.1 -0.3 0.5 0.7 0.9 0.0877647 0.0877647 base value 0.000646759 0.000646759 ffear (inputs) 0.01 t 0.004 didn 0.001 i -0.08 humiliated -0.022 feel -0.0 -0.0 0.04 0.02 0 0.06 0.08 0.1 0.0877647 0.0877647 base value 0.000646759 0.000646759 ffear (inputs) 0.01 t 0.004 didn 0.001 i -0.08 humiliated -0.022 feel -0.0 -0.0 0.3 0.1 -0.1 -0.3 0.5 0.7 0.9 0.172157 0.172157 base value 0.00038233 0.00038233 fsurprise (inputs) -0.105 humiliated -0.023 didn -0.021 t -0.021 feel -0.003 i -0.0 -0.0 0.09 0.06 0.03 0 0.12 0.15 0.172157 0.172157 base value 0.00038233 0.00038233 fsurprise (inputs) -0.105 humiliated -0.023 didn -0.021 t -0.021 feel -0.003 i -0.0 -0.0
outputs
sadness
joy
love
anger
fear
surprise
0.3 0.1 -0.1 -0.3 0.5 0.7 0.9 0.144195 0.144195 base value 0.995292 0.995292 fsadness (inputs) 0.599 hopeless 0.28 feeling 0.039 so 0.004 from 0.004 damned 0.002 from 0.002 awake 0.002 i 0.001 to 0.001 who 0.0 go 0.0 0.0 -0.045 hopeful -0.011 cares -0.006 just -0.006 is -0.004 someone -0.003 can -0.002 and -0.002 being -0.002 around -0.001 so 0.6 0.4 0.2 0.8 1 0.144195 0.144195 base value 0.995292 0.995292 fsadness (inputs) 0.599 hopeless 0.28 feeling 0.039 so 0.004 from 0.004 damned 0.002 from 0.002 awake 0.002 i 0.001 to 0.001 who 0.0 go 0.0 0.0 -0.045 hopeful -0.011 cares -0.006 just -0.006 is -0.004 someone -0.003 can -0.002 and -0.002 being -0.002 around -0.001 so 0.3 0.1 -0.1 -0.3 0.5 0.7 0.9 0.200289 0.200289 base value 0.00119147 0.00119147 fjoy (inputs) 0.25 hopeful 0.052 awake 0.029 cares 0.022 just 0.019 is 0.017 and 0.011 someone 0.01 so 0.009 who 0.005 can 0.003 being 0.002 from 0.002 to -0.377 hopeless -0.203 feeling -0.017 around -0.015 from -0.015 damned -0.001 i -0.001 go -0.001 so -0.0 -0.0 0.1 -0.1 -0.3 0.3 0.5 0.200289 0.200289 base value 0.00119147 0.00119147 fjoy (inputs) 0.25 hopeful 0.052 awake 0.029 cares 0.022 just 0.019 is 0.017 and 0.011 someone 0.01 so 0.009 who 0.005 can 0.003 being 0.002 from 0.002 to -0.377 hopeless -0.203 feeling -0.017 around -0.015 from -0.015 damned -0.001 i -0.001 go -0.001 so -0.0 -0.0 0.3 0.1 -0.1 -0.3 0.5 0.7 0.9 0.0959971 0.0959971 base value 0.000996302 0.000996302 flove (inputs) 0.049 cares 0.019 someone 0.003 around 0.002 just 0.001 i 0.001 can 0.0 from 0.0 damned 0.0 so -0.049 hopeless -0.038 hopeful -0.031 and -0.019 awake -0.007 is -0.006 from -0.006 so -0.005 feeling -0.003 being -0.003 who -0.002 to -0.001 go -0.0 -0.0 0.05 0.01 -0.03 -0.07 0.09 0.13 0.17 0.0959971 0.0959971 base value 0.000996302 0.000996302 flove (inputs) 0.049 cares 0.019 someone 0.003 around 0.002 just 0.001 i 0.001 can 0.0 from 0.0 damned 0.0 so -0.049 hopeless -0.038 hopeful -0.031 and -0.019 awake -0.007 is -0.006 from -0.006 so -0.005 feeling -0.003 being -0.003 who -0.002 to -0.001 go -0.0 -0.0 0.3 0.1 -0.1 -0.3 0.5 0.7 0.9 0.271629 0.271629 base value 0.00046282 0.00046282 fanger (inputs) 0.015 damned 0.007 around 0.005 from 0.005 to 0.004 so 0.003 from 0.003 go 0.002 i 0.001 is -0.097 hopeful -0.08 hopeless -0.045 feeling -0.027 awake -0.021 cares -0.016 so -0.009 someone -0.008 just -0.005 can -0.004 and -0.002 who -0.001 being -0.0 -0.0 0.1 0 0.2 0.3 0.271629 0.271629 base value 0.00046282 0.00046282 fanger (inputs) 0.015 damned 0.007 around 0.005 from 0.005 to 0.004 so 0.003 from 0.003 go 0.002 i 0.001 is -0.097 hopeful -0.08 hopeless -0.045 feeling -0.027 awake -0.021 cares -0.016 so -0.009 someone -0.008 just -0.005 can -0.004 and -0.002 who -0.001 being -0.0 -0.0 0.3 0.1 -0.1 -0.3 0.5 0.7 0.9 0.123025 0.123025 base value 0.00164944 0.00164944 ffear (inputs) 0.02 and 0.003 around 0.001 from 0.0 from 0.0 to -0.032 cares -0.025 hopeful -0.02 feeling -0.019 hopeless -0.011 so -0.009 just -0.007 i -0.006 someone -0.004 who -0.004 can -0.003 damned -0.003 so -0.002 is -0.002 awake -0.001 being -0.001 go -0.0 -0.0 0.06 0.03 0 0.09 0.12 0.123025 0.123025 base value 0.00164944 0.00164944 ffear (inputs) 0.02 and 0.003 around 0.001 from 0.0 from 0.0 to -0.032 cares -0.025 hopeful -0.02 feeling -0.019 hopeless -0.011 so -0.009 just -0.007 i -0.006 someone -0.004 who -0.004 can -0.003 damned -0.003 so -0.002 is -0.002 awake -0.001 being -0.001 go -0.0 -0.0 0.3 0.1 -0.1 -0.3 0.5 0.7 0.9 0.164865 0.164865 base value 0.000407605 0.000407605 fsurprise (inputs) 0.006 can 0.005 being 0.005 around 0.005 from 0.004 i 0.0 so 0.0 and -0.073 hopeless -0.045 hopeful -0.017 so -0.014 cares -0.011 someone -0.007 feeling -0.006 to -0.005 awake -0.005 is -0.003 from -0.001 damned -0.001 who -0.001 just -0.001 go -0.0 -0.0 0.08 0.04 0 0.12 0.16 0.164865 0.164865 base value 0.000407605 0.000407605 fsurprise (inputs) 0.006 can 0.005 being 0.005 around 0.005 from 0.004 i 0.0 so 0.0 and -0.073 hopeless -0.045 hopeful -0.017 so -0.014 cares -0.011 someone -0.007 feeling -0.006 to -0.005 awake -0.005 is -0.003 from -0.001 damned -0.001 who -0.001 just -0.001 go -0.0 -0.0
outputs
sadness
joy
love
anger
fear
surprise
0.3 0.1 -0.1 -0.3 0.5 0.7 0.9 0.15261 0.15261 base value 0.00227724 0.00227724 fsadness (inputs) 0.0 i 0.0 0.0 -0.097 greedy -0.019 feel -0.013 grabbing -0.007 im -0.005 a -0.005 to -0.003 post -0.001 wrong -0.0 minute 0.08 0.05 0.02 0.11 0.14 0.15261 0.15261 base value 0.00227724 0.00227724 fsadness (inputs) 0.0 i 0.0 0.0 -0.097 greedy -0.019 feel -0.013 grabbing -0.007 im -0.005 a -0.005 to -0.003 post -0.001 wrong -0.0 minute 0.3 0.1 -0.1 -0.3 0.5 0.7 0.9 0.281573 0.281573 base value 0.000683205 0.000683205 fjoy (inputs) 0.109 feel 0.026 to 0.014 im 0.01 a 0.005 i 0.0 -0.3 greedy -0.124 wrong -0.017 minute -0.002 grabbing -0.002 post -0.0 0.1 0 -0.1 0.2 0.3 0.4 0.281573 0.281573 base value 0.000683205 0.000683205 fjoy (inputs) 0.109 feel 0.026 to 0.014 im 0.01 a 0.005 i 0.0 -0.3 greedy -0.124 wrong -0.017 minute -0.002 grabbing -0.002 post -0.0 0.3 0.1 -0.1 -0.3 0.5 0.7 0.9 0.110062 0.110062 base value 0.00207604 0.00207604 flove (inputs) 0.004 minute 0.001 i -0.038 greedy -0.027 wrong -0.017 feel -0.013 grabbing -0.009 post -0.003 to -0.003 im -0.002 a -0.0 -0.0 0.06 0.04 0.02 0 0.08 0.1 0.110062 0.110062 base value 0.00207604 0.00207604 flove (inputs) 0.004 minute 0.001 i -0.038 greedy -0.027 wrong -0.017 feel -0.013 grabbing -0.009 post -0.003 to -0.003 im -0.002 a -0.0 -0.0 0.3 0.1 -0.1 -0.3 0.5 0.7 0.9 0.230373 0.230373 base value 0.991462 0.991462 fanger (inputs) 0.555 greedy 0.169 wrong 0.025 grabbing 0.023 post 0.005 minute 0.005 im 0.005 feel 0.0 -0.016 to -0.006 a -0.004 i -0.0 0.6 0.5 0.4 0.3 0.2 0.7 0.8 0.9 1 0.230373 0.230373 base value 0.991462 0.991462 fanger (inputs) 0.555 greedy 0.169 wrong 0.025 grabbing 0.023 post 0.005 minute 0.005 im 0.005 feel 0.0 -0.016 to -0.006 a -0.004 i -0.0 0.3 0.1 -0.1 -0.3 0.5 0.7 0.9 0.0859759 0.0859759 base value 0.00193623 0.00193623 ffear (inputs) 0.02 grabbing 0.008 post 0.006 wrong 0.003 im 0.0 to 0.0 0.0 -0.063 greedy -0.042 feel -0.009 minute -0.006 i -0.002 a 0.04 0.01 -0.02 0.07 0.1 0.0859759 0.0859759 base value 0.00193623 0.00193623 ffear (inputs) 0.02 grabbing 0.008 post 0.006 wrong 0.003 im 0.0 to 0.0 0.0 -0.063 greedy -0.042 feel -0.009 minute -0.006 i -0.002 a 0.3 0.1 -0.1 -0.3 0.5 0.7 0.9 0.139406 0.139406 base value 0.00156488 0.00156488 fsurprise (inputs) 0.016 minute 0.005 i 0.005 a -0.057 greedy -0.036 feel -0.024 wrong -0.017 post -0.017 grabbing -0.012 im -0.001 to -0.0 -0.0 0.07 0.04 0.01 -0.02 0.1 0.13 0.16 0.139406 0.139406 base value 0.00156488 0.00156488 fsurprise (inputs) 0.016 minute 0.005 i 0.005 a -0.057 greedy -0.036 feel -0.024 wrong -0.017 post -0.017 grabbing -0.012 im -0.001 to -0.0 -0.0
Visualize the impact on a single class
Since Explanation
0.5 0.3 0.1 0.7 0.9 0.278915 0.278915 base value 0.00123321 0.00123321 fanger (inputs) 0.028 didn 0.015 i 0.008 t -0.199 humiliated -0.13 feel -0.0 -0.0
0.5 0.3 0.1 0.7 0.9 0.271629 0.271629 base value 0.00046282 0.00046282 fanger (inputs) 0.015 damned 0.005 from 0.005 to 0.004 so 0.004 around 0.002 i 0.002 being 0.001 is 0.0 -0.097 hopeful -0.08 hopeless -0.045 feeling -0.028 awake -0.021 cares -0.016 so -0.008 someone -0.004 just -0.004 who -0.003 and -0.003 can go -0.001 from -0.0
0.5 0.3 0.1 0.7 0.9 0.230373 0.230373 base value 0.991462 0.991462 fanger (inputs) 0.545 greedy 0.118 wrong 0.07 grabbing 0.023 post 0.015 im 0.006 feel 0.005 minute 0.0 -0.016 to -0.004 i -0.001 a -0.0
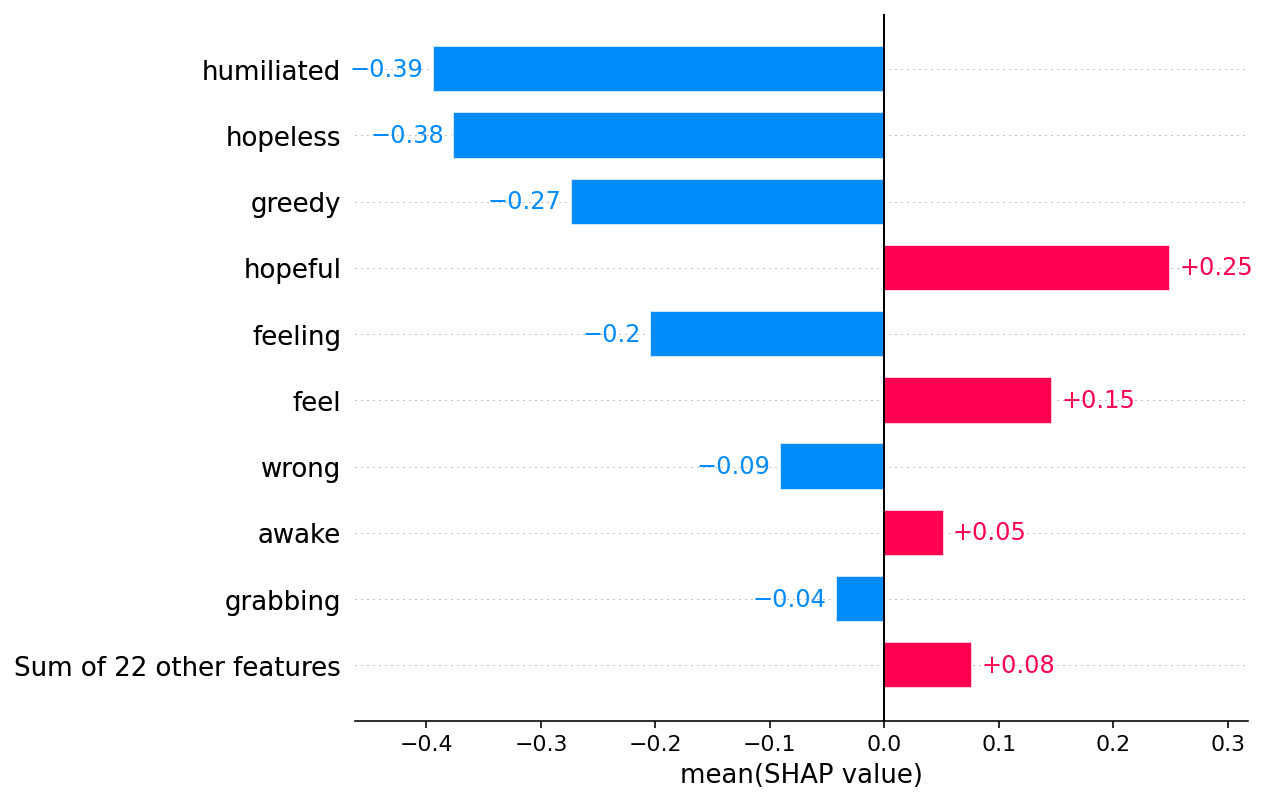
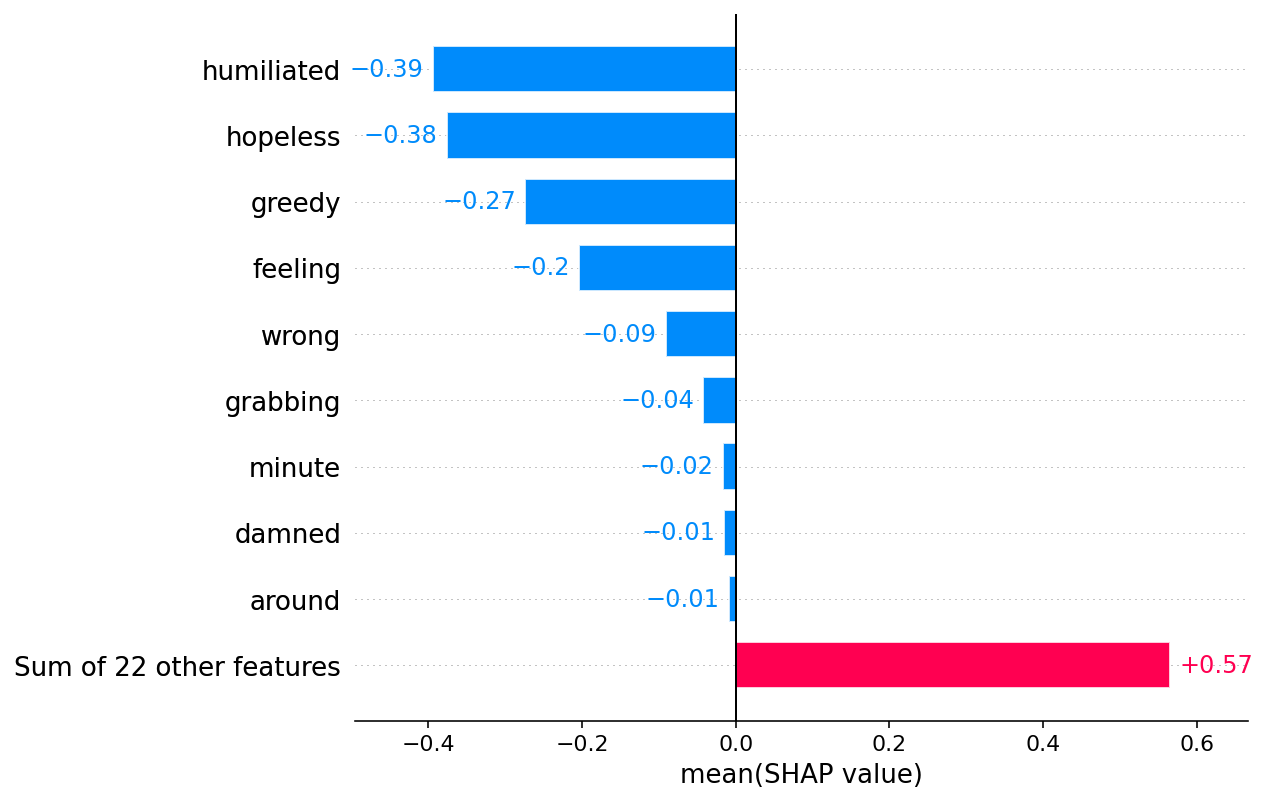
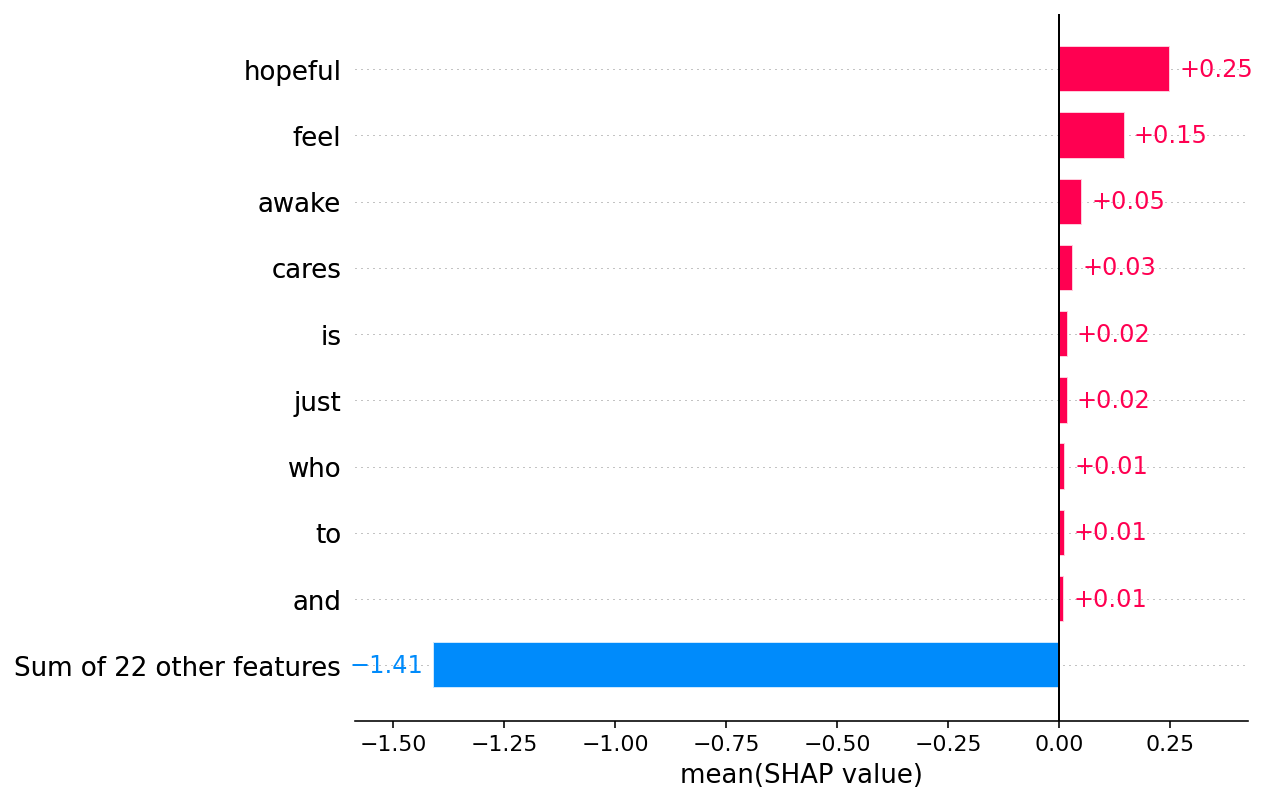
Plotting the top words impacting a specific class
In addition to slicing, Explanation .mean(0)
Explain the log odds instead of the probabilities
In the examples above we explained the direct output of the pipline object, which are class probabilities. Sometimes it makes more sense to work in a log odds space where it is natural to add and subtract effects (addition and subtraction correspond to the addition or subtraction of bits of evidence information). To work with logits we can use a parameter of the shap.models.TransformersPipeline
outputs
sadness
joy
love
anger
fear
surprise
-1 -4 -7 2 5 -1.88626 -1.88626 base value 5.62544 5.62544 fsadness (inputs) 6.901 humiliated 0.201 feel 0.173 didn 0.16 i 0.076 t 0.0 -0.0 2 1 0 -1 3 4 5 -1.88626 -1.88626 base value 5.62544 5.62544 fsadness (inputs) 6.901 humiliated 0.201 feel 0.173 didn 0.16 i 0.076 t 0.0 -0.0 -1 -4 -7 2 5 -1.24955 -1.24955 base value -7.2917 -7.2917 fjoy (inputs) 0.511 feel 0.14 t 0.098 didn 0.0 0.0 -6.736 humiliated -0.055 i -4 -5 -6 -7 -8 -3 -2 -1 -1.24955 -1.24955 base value -7.2917 -7.2917 fjoy (inputs) 0.511 feel 0.14 t 0.098 didn 0.0 0.0 -6.736 humiliated -0.055 i -1 -4 -7 2 5 -2.12476 -2.12476 base value -7.33942 -7.33942 flove (inputs) 0.0 -4.673 humiliated -0.247 didn -0.115 i -0.109 t -0.07 feel -0.0 -5 -6 -7 -4 -3 -2.12476 -2.12476 base value -7.33942 -7.33942 flove (inputs) 0.0 -4.673 humiliated -0.247 didn -0.115 i -0.109 t -0.07 feel -0.0 -1 -4 -7 2 5 -0.94985 -0.94985 base value -6.6969 -6.6969 fanger (inputs) 0.0 -4.175 humiliated -1.233 feel -0.151 t -0.138 didn -0.05 i -0.0 -4 -5 -6 -3 -2 -1 -0.94985 -0.94985 base value -6.6969 -6.6969 fanger (inputs) 0.0 -4.175 humiliated -1.233 feel -0.151 t -0.138 didn -0.05 i -0.0 -1 -4 -7 2 5 -2.34124 -2.34124 base value -7.34289 -7.34289 ffear (inputs) 0.147 t 0.112 didn 0.0 -4.298 humiliated -0.685 feel -0.278 i -0.0 -5 -6 -7 -4 -3 -2.34124 -2.34124 base value -7.34289 -7.34289 ffear (inputs) 0.147 t 0.112 didn 0.0 -4.298 humiliated -0.685 feel -0.278 i -0.0 -1 -4 -7 2 5 -1.57041 -1.57041 base value -7.86884 -7.86884 fsurprise (inputs) 0.0 -5.187 humiliated -0.437 feel -0.258 didn -0.231 t -0.185 i -0.0 -5 -6 -7 -4 -3 -2 -1.57041 -1.57041 base value -7.86884 -7.86884 fsurprise (inputs) 0.0 -5.187 humiliated -0.437 feel -0.258 didn -0.231 t -0.185 i -0.0
outputs
sadness
joy
love
anger
fear
surprise
-1 -4 -7 2 5 -1.78088 -1.78088 base value 5.35388 5.35388 fsadness (inputs) 5.914 hopeless 2.741 feeling 0.248 so 0.079 to so 0.063 can go 0.053 damned 0.029 from -1.3 hopeful -0.172 just from -0.135 awake -0.119 cares -0.11 someone who -0.071 being around -0.054 is -0.025 i -0.006 and -0.0 2 0 -2 4 6 -1.78088 -1.78088 base value 5.35388 5.35388 fsadness (inputs) 5.914 hopeless 2.741 feeling 0.248 so 0.079 to so 0.063 can go 0.053 damned 0.029 from -1.3 hopeful -0.172 just from -0.135 awake -0.119 cares -0.11 someone who -0.071 being around -0.054 is -0.025 i -0.006 and -0.0 -1 -4 -7 2 5 -1.38449 -1.38449 base value -6.73137 -6.73137 fjoy (inputs) 1.644 hopeful 0.326 awake 0.174 just from 0.098 someone who 0.093 is 0.084 cares 0.075 to so 0.059 and 0.059 i 0.047 damned 0.0 -4.702 hopeless -3.062 feeling -0.13 so -0.071 being around -0.024 can go -0.016 from -4 -6 -8 -2 0 -1.38449 -1.38449 base value -6.73137 -6.73137 fjoy (inputs) 1.644 hopeful 0.326 awake 0.174 just from 0.098 someone who 0.093 is 0.084 cares 0.075 to so 0.059 and 0.059 i 0.047 damned 0.0 -4.702 hopeless -3.062 feeling -0.13 so -0.071 being around -0.024 can go -0.016 from -1 -4 -7 2 5 -2.24251 -2.24251 base value -6.91046 -6.91046 flove (inputs) 0.216 cares 0.168 to so 0.111 damned 0.001 being around 0.0 -1.771 hopeless -1.567 feeling -0.572 hopeful -0.256 awake -0.241 so -0.163 just from -0.148 is -0.12 i -0.109 can go -0.092 from -0.086 and -0.039 someone who -5 -6 -7 -4 -3 -2 -2.24251 -2.24251 base value -6.91046 -6.91046 flove (inputs) 0.216 cares 0.168 to so 0.111 damned 0.001 being around 0.0 -1.771 hopeless -1.567 feeling -0.572 hopeful -0.256 awake -0.241 so -0.163 just from -0.148 is -0.12 i -0.109 can go -0.092 from -0.086 and -0.039 someone who -1 -4 -7 2 5 -0.986371 -0.986371 base value -7.67771 -7.67771 fanger (inputs) 0.126 damned 0.07 to so 0.005 being around 0.0 -1.79 feeling -1.629 hopeful -1.51 hopeless -0.485 awake -0.307 so -0.305 someone who -0.27 cares -0.188 just from -0.122 i -0.117 and -0.078 is -0.054 can go -0.037 from -4 -5 -6 -7 -3 -2 -1 -0.986371 -0.986371 base value -7.67771 -7.67771 fanger (inputs) 0.126 damned 0.07 to so 0.005 being around 0.0 -1.79 feeling -1.629 hopeful -1.51 hopeless -0.485 awake -0.307 so -0.305 someone who -0.27 cares -0.188 just from -0.122 i -0.117 and -0.078 is -0.054 can go -0.037 from -1 -4 -7 2 5 -1.96409 -1.96409 base value -6.40567 -6.40567 ffear (inputs) 0.0 -1.092 feeling -1.029 hopeful -0.367 hopeless -0.364 cares -0.261 someone who -0.254 just from -0.25 so -0.204 i -0.169 awake -0.126 can go -0.083 and -0.061 damned -0.051 is -0.049 from -0.046 to so -0.035 being around -4 -5 -6 -3 -2 -1.96409 -1.96409 base value -6.40567 -6.40567 ffear (inputs) 0.0 -1.092 feeling -1.029 hopeful -0.367 hopeless -0.364 cares -0.261 someone who -0.254 just from -0.25 so -0.204 i -0.169 awake -0.126 can go -0.083 and -0.061 damned -0.051 is -0.049 from -0.046 to so -0.035 being around -1 -4 -7 2 5 -1.62247 -1.62247 base value -7.80481 -7.80481 fsurprise (inputs) 0.067 being around 0.0 -1.848 hopeless -1.403 feeling -1.149 hopeful -0.35 someone who -0.304 so -0.253 awake -0.238 cares -0.193 just from -0.153 is -0.115 and -0.104 i -0.051 to so -0.05 from -0.033 can go -0.005 damned -5 -6 -7 -4 -3 -2 -1.62247 -1.62247 base value -7.80481 -7.80481 fsurprise (inputs) 0.067 being around 0.0 -1.848 hopeless -1.403 feeling -1.149 hopeful -0.35 someone who -0.304 so -0.253 awake -0.238 cares -0.193 just from -0.153 is -0.115 and -0.104 i -0.051 to so -0.05 from -0.033 can go -0.005 damned
outputs
sadness
joy
love
anger
fear
surprise
-1 -4 -7 2 5 -1.71428 -1.71428 base value -6.08251 -6.08251 fsadness (inputs) 0.212 wrong 0.009 post 0.0 0.0 -3.174 greedy -0.528 feel -0.518 grabbing -0.152 im -0.131 a -0.067 to -0.02 i -0.0 minute -4 -5 -6 -3 -2 -1.71428 -1.71428 base value -6.08251 -6.08251 fsadness (inputs) 0.212 wrong 0.009 post 0.0 0.0 -3.174 greedy -0.528 feel -0.518 grabbing -0.152 im -0.131 a -0.067 to -0.02 i -0.0 minute -1 -4 -7 2 5 -0.936672 -0.936672 base value -7.28803 -7.28803 fjoy (inputs) 0.085 to 0.024 i -4.456 greedy -0.694 wrong -0.54 grabbing -0.484 feel -0.193 im -0.06 minute -0.017 post -0.016 a -0.0 -0.0 -4 -5 -6 -7 -3 -2 -1 -0.936672 -0.936672 base value -7.28803 -7.28803 fjoy (inputs) 0.085 to 0.024 i -4.456 greedy -0.694 wrong -0.54 grabbing -0.484 feel -0.193 im -0.06 minute -0.017 post -0.016 a -0.0 -0.0 -1 -4 -7 2 5 -2.09011 -2.09011 base value -6.17521 -6.17521 flove (inputs) 0.099 minute 0.037 i -1.912 greedy -1.019 feel -0.506 grabbing -0.351 wrong -0.159 im -0.126 post -0.088 to -0.061 a -0.0 -0.0 -4 -5 -6 -3 -2 -2.09011 -2.09011 base value -6.17521 -6.17521 flove (inputs) 0.099 minute 0.037 i -1.912 greedy -1.019 feel -0.506 grabbing -0.351 wrong -0.159 im -0.126 post -0.088 to -0.061 a -0.0 -0.0 -1 -4 -7 2 5 -1.2062 -1.2062 base value 4.7547 4.7547 fanger (inputs) 4.816 greedy 0.578 grabbing 0.408 wrong 0.18 im 0.085 post 0.08 a 0.025 minute 0.0 -0.136 feel -0.052 to -0.023 i -0.0 2 1 0 -1 3 4 5 -1.2062 -1.2062 base value 4.7547 4.7547 fanger (inputs) 4.816 greedy 0.578 grabbing 0.408 wrong 0.18 im 0.085 post 0.08 a 0.025 minute 0.0 -0.136 feel -0.052 to -0.023 i -0.0 -1 -4 -7 2 5 -2.36379 -2.36379 base value -6.24508 -6.24508 ffear (inputs) 0.116 post 0.102 grabbing 0.009 wrong 0.0 -2.742 greedy -1.13 feel -0.103 a -0.07 minute -0.038 im -0.023 i -0.002 to -0.0 -4 -5 -6 -3 -2.36379 -2.36379 base value -6.24508 -6.24508 ffear (inputs) 0.116 post 0.102 grabbing 0.009 wrong 0.0 -2.742 greedy -1.13 feel -0.103 a -0.07 minute -0.038 im -0.023 i -0.002 to -0.0 -1 -4 -7 2 5 -1.82023 -1.82023 base value -6.45838 -6.45838 fsurprise (inputs) 0.164 minute 0.04 i 0.016 a 0.0 -2.767 greedy -1.11 feel -0.549 grabbing -0.232 im -0.121 post -0.042 wrong -0.037 to -0.0 -4 -5 -6 -3 -2 -1.82023 -1.82023 base value -6.45838 -6.45838 fsurprise (inputs) 0.164 minute 0.04 i 0.016 a 0.0 -2.767 greedy -1.11 feel -0.549 grabbing -0.232 im -0.121 post -0.042 wrong -0.037 to -0.0
Have an idea for more helpful examples? Pull requests that add to this documentation notebook are encouraged!