This notebook is designed to demonstrate (and so document) how to use the shap.plots.text function. It uses a distilled PyTorch BERT model from the transformers package to do sentiment analysis of IMDB movie reviews.
Note that the prediction function we define takes a list of strings and returns a logit value for the positive class.
[9]:
importnlpimportnumpyasnpimportscipyasspimporttorchimporttransformersimportshap# load a BERT sentiment analysis modeltokenizer=transformers.DistilBertTokenizerFast.from_pretrained("distilbert-base-uncased")model=transformers.DistilBertForSequenceClassification.from_pretrained("distilbert-base-uncased-finetuned-sst-2-english").cuda()# define a prediction functiondeff(x):tv=torch.tensor([tokenizer.encode(v,padding="max_length",max_length=500,truncation=True)forvinx]).cuda()outputs=model(tv)[0].detach().cpu().numpy()scores=(np.exp(outputs).T/np.exp(outputs).sum(-1)).Tval=sp.special.logit(scores[:,1])# use one vs rest logit unitsreturnval# build an explainer using a token maskerexplainer=shap.Explainer(f,tokenizer)# explain the model's predictions on IMDB reviewsimdb_train=nlp.load_dataset("imdb")["train"]shap_values=explainer(imdb_train[:10],fixed_context=1)
When we pass a single instance to the text plot we get the importance of each token overlayed on the original text that corresponds to that token. Red regions correspond to parts of the text that increase the output of the model when they are included, while blue regions decrease the output of the model when they are included. In the context of the sentiment analysis model here red corresponds to a more positive review and blue a more negative review.
Note that importance values returned for text models are often hierarchical and follow the structure of the text. Nonlinear interactions between groups of tokens are often saved and can be used during the plotting process. If the Explanation object passed to the text plot has a .hierarchical_values attribute, then small groups of tokens with strong non-linear effects among them will be auto-merged together to form coherent chunks. When the .hierarchical_values attribute is present it
also means that the explainer may not have completely enumerated all possible token perturbations and so has treated chunks of the text as essentially a single unit. This happens since we often want to explain a text model while evaluating it fewer times than the numbers of tokens in the document. Whenever a region of the input text is not split by the explainer, it is show by the text plot as a single unit.
The force plot above the text is designed to provide an overview of how all the parts of the text combine to produce the model’s output. See the `force plot <>`__ notebook for more details, but the general structure of the plot is positive red features “pushing” the model output higher while negative blue features “push” the model output lower. The force plot provides much more quantitative information than the text coloring. Hovering over a chuck of text will underline the portion of the force
plot that corresponds to that chunk of text, and hovering over a portion of the force plot will underline the corresponding chunk of text.
Note that clicking on any chunk of text will show the sum of the SHAP values attributed to the tokens in that chunk (clicked again will hide the value).
[10]:
# plot the first sentence's explanationshap.plots.text(shap_values[3])
-0.0
-0.167 / 2
This is
-0.357 / 3
easily the most
-0.176 / 8
underrated film inn the Brooks cannon.
-0.627 / 15
Sure, its flawed. It does not give a realistic view of homelessness
-0.167 / 27
(unlike, say, how Citizen Kane gave a realistic view of lounge singers, or Titanic gave a realistic view of Italians YOU IDIOTS)
-0.511
.
-0.775 / 7
Many of the jokes fall flat.
2.49
But
1.319 / 2
still,
-0.684 / 2
this film
0.484
is
0.083
very
2.385 / 2
lovable
-0.518 / 2
in a
-0.093 / 6
way many comedies are not,
-0.4 / 9
and to pull that off in a story about
0.518 / 9
some of the most traditionally reviled members of
-0.958
society
1.676
is
-0.004
truly
2.222
impressive
-0.012
.
0.977 / 13
Its not The Fisher King, but its not crap, either.
-0.554 / 14
My only complaint is that Brooks should have cast someone else in the lead
-0.346 / 18
(I love Mel as a Director and Writer, not so much as a lead).
When we pass a multi-row explanation object to the text plot we get the single instance plots for each input instance scaled so they have consistent comparable x-axis and color ranges.
[11]:
# plot the first sentence's explanationshap.plots.text(shap_values[:3])
Creating an ndarray from ragged nested sequences (which is a list-or-tuple of lists-or-tuples-or ndarrays with different lengths or shapes) is deprecated. If you meant to do this, you must specify 'dtype=object' when creating the ndarray
0th instance:
0.0
0.098 / 5
Bromwell High is
-0.168 / 3
a cartoon comedy
-0.051
.
-0.143
It
-0.396
ran
-0.058 / 2
at the
-0.275 / 4
same time as some
0.153 / 6
other programs about school life,
-0.121 / 6
such as "Teachers".
-0.319 / 8
My 35 years in the teaching profession lead
-0.101 / 10
me to believe that Bromwell High's
-0.318 / 8
satire is much closer to reality than is
-0.329 / 4
"Teachers".
1.306 / 82
The scramble to survive financially, the insightful students who can see right through their pathetic teachers' pomp, the pettiness of the whole situation, all remind me of the schools I knew and their students. When I saw the episode in which a student repeatedly tried to burn down the school, I immediately recalled ......... at .........
-0.033 / 3
. High.
-0.115 / 8
A classic line: INSPECTOR: I'
-0.128 / 9
m here to sack one of your teachers.
0.085 / 9
STUDENT: Welcome to Bromwell High.
-0.04 / 8
I expect that many adults of my age
0.022 / 5
think that Bromwell
-0.216 / 2
High is
-0.026
far
-0.1 / 2
fetched
-0.116
.
-0.177 / 9
What a pity that it isn't!
0.0
1st instance:
0.0
-0.378 / 49
Homelessness (or Houselessness as George Carlin stated) has been an issue for years but never a plan to help those on the street that were once considered human who did everything from going to school, work, or vote for the matter.
-0.2 / 52
Most people think of the homeless as just a lost cause while worrying about things such as racism, the war on Iraq, pressuring kids to succeed, technology, the elections, inflation, or worrying if they'll be next to end up on the streets.
-0.086 / 157
<br /><br />But what if you were given a bet to live on the streets for a month without the luxuries you once had from a home, the entertainment sets, a bathroom, pictures on the wall, a computer, and everything you once treasure to see what it's like to be homeless? That is Goddard Bolt's lesson.<br /><br />Mel Brooks (who directs) who stars as Bolt plays a rich man who has everything in the world until deciding to make a bet with a sissy rival (Jeffery Tambor) to see if he can live in the streets for thirty days without the luxuries; if Bolt succeeds, he can do what he wants with a future project of making more buildings.
0.557 / 33
The bet's on where Bolt is thrown on the street with a bracelet on his leg to monitor his every move where he can't step off the sidewalk.
-0.407 / 24
He's given the nickname Pepto by a vagrant after it's written on his forehead where Bolt meets other
-0.024 / 26
characters including a woman by the name of Molly (Lesley Ann Warren) an ex-dancer who got divorce before losing her home,
0.046 / 34
and her pals Sailor (Howard Morris) and Fumes (Teddy Wilson) who are already used to the streets. They're survivors. Bolt isn't.
-0.275 / 3
He's
-0.909 / 2
not used
-0.347 / 2
to reaching
-0.269 / 10
mutual agreements like he once did when being rich where
0.386 / 12
it's fight or flight, kill or be killed.
0.838 / 14
<br /><br />While the love connection between Molly
-0.154 / 5
and Bolt wasn't
-0.948 / 4
necessary to plot,
-2.105 / 2
I found
-1.711 / 2
"Life
-2.169 / 2
Stinks
-0.451 / 2
" to
0.3 / 9
be one of Mel Brooks' observant
1.385 / 8
films where prior to being a comedy,
1.915 / 17
it shows a tender side compared to his slapstick work such as Blazing Saddles,
0.119 / 10
Young Frankenstein, or Spaceballs for the matter,
0.324 / 43
to show what it's like having something valuable before losing it the next day or on the other hand making a stupid bet like all rich people do when they don't know what to do with their money.
1.159 / 35
Maybe they should give it to the homeless instead of using it like Monopoly money.<br /><br />Or maybe this film will inspire you to help others.
0.0
2nd instance:
0.0
0.836 / 30
Brilliant over-acting by Lesley Ann Warren. Best dramatic hobo lady I have ever seen, and love scenes in clothes warehouse are second to none.
0.179 / 4
The corn on face
0.695 / 2
is a
0.1
classic
-0.013
,
0.232 / 2
as good
0.322 / 2
as anything
0.373 / 5
in Blazing Saddles.
0.255
The
0.158
take
0.272
on
0.143
lawyers
1.598 / 2
is also
0.718
superb
-0.59
.
0.441 / 4
After being accused of
0.299 / 5
being a turncoat,
0.24 / 5
selling out his boss,
0.215 / 24
and being dishonest the lawyer of Pepto Bolt shrugs indifferently "I'm a lawyer" he says.
0.173 / 63
Three funny words. Jeffrey Tambor, a favorite from the later Larry Sanders show, is fantastic here too as a mad millionaire who wants to crush the ghetto. His character is more malevolent than usual. The hospital scene, and the scene where the homeless invade a demolition site, are all-time classics.
0.087 / 18
Look for the legs scene and the two big diggers fighting (one bleeds).
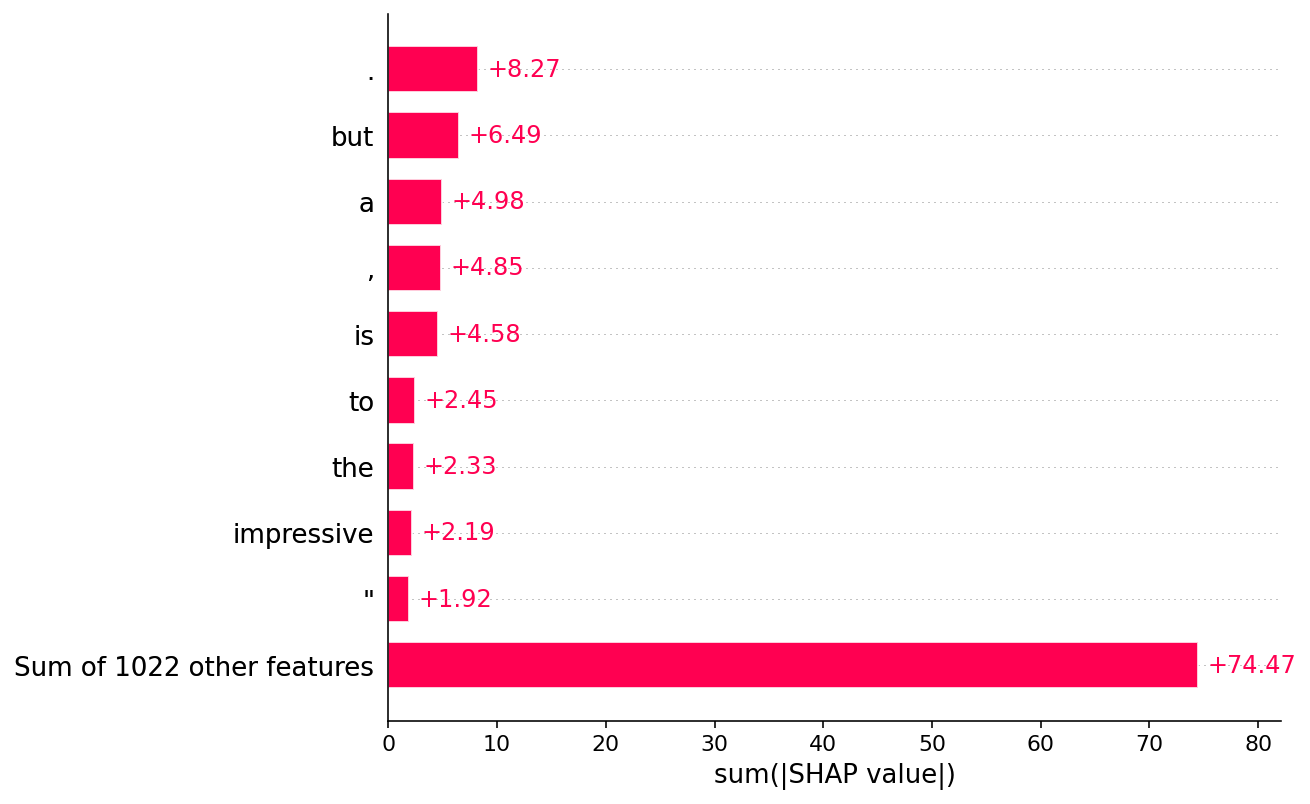
While plotting several instance-level explanations using the text plot can be very informative, sometime you want global summaries of the impact of tokens over the a large set of instances. See the `Explanation object <>`__ documentation for more details, but you can easily summarize the importance of tokens in a dataset by collapsing a multi-row explanation object over all it’s rows (in this case by summing). Doing this treats every text input token type as a feature, so the collapsed
Explanation object will have as many columns as there were unique tokens in the orignal multi-row explanation object. If there are hierarchical values present in the Explanation object then any large groups are divided up and each token in the gruop is given an equal share of the overall group importance value.
[12]:
shap.plots.bar(shap_values.abs.sum(0))
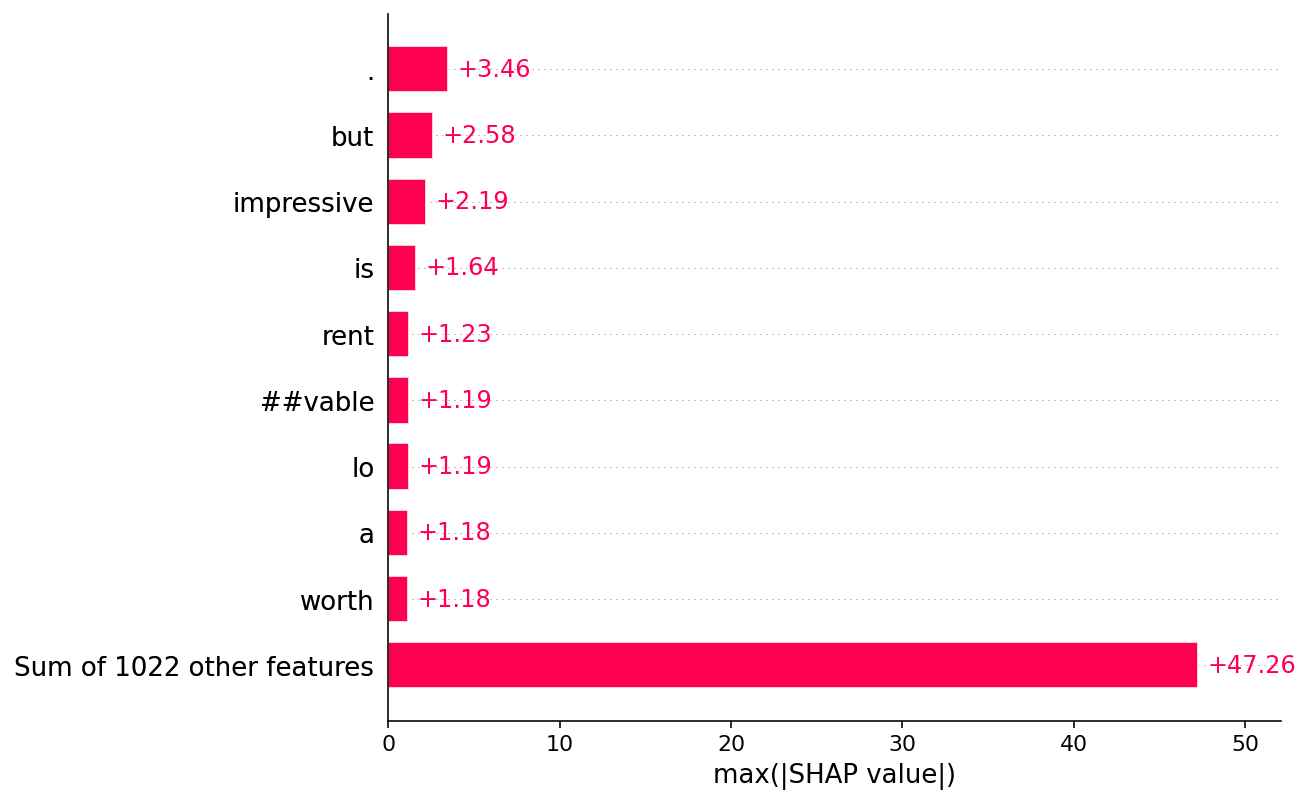
Note that how you summarize the importance of features can make a big difference. In the plot above the a token was very importance both because it had an impact on the model, and because it was very common. Below we instead summize the instances using the max function to see the largest impact of a token in any instance.
[13]:
shap.plots.bar(shap_values.abs.max(0))
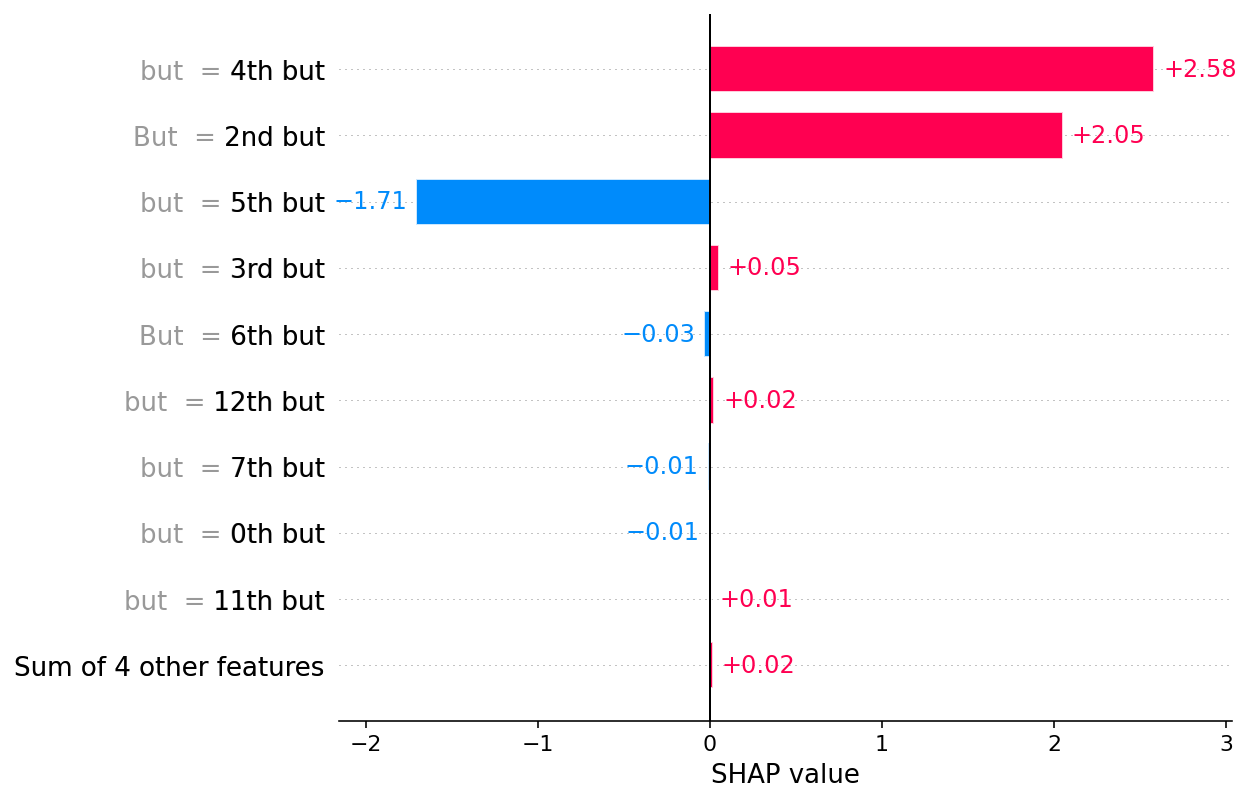
You can also slice out a single token from all the instances by using that token as an input name (note that the gray values to the left of the input names are the original text that the token was generated from).
fromtransformersimportAutoModelForSeq2SeqLM,AutoTokenizerimportshaptokenizer=AutoTokenizer.from_pretrained("Helsinki-NLP/opus-mt-en-es")model=AutoModelForSeq2SeqLM.from_pretrained("Helsinki-NLP/opus-mt-en-es").cuda()s=["In this picture, there are four persons: my father, my mother, my brother and my sister."]explainer=shap.Explainer(model,tokenizer)shap_values=explainer(s)
Text-To-Text Visualization contains the input text to the model on the left side and output text on the right side (in the default layout). On hovering over a token on the right (output) side the importance of each input token is overlayed on it, and is signified by the background color of the token. Red regions correspond to parts of the text that increase the output of the model when they are included, while blue regions decrease the output of the model when they are included. The explanation
for a particular output token can be anchored by clickling on the output token (it can be un-anchored by clicking again).
Note that similar to the single output plots described above, importance values returned for text models are often hierarchical and follow the structure of the text. Small groups of tokens with strong non-linear effects among them will be auto-merged together to form coherent chunks. Similarly, The explainer may not have completely enumerated all possible token perturbations and so has treated chunks of the text as essentially a single unit. This preprocessing is done for each output token, and
the merging behviour can differ for each output token, since the interation effects might be different for each output token. The merged chunks can be viewed by hovering over the input text, once an output token is anchored. All the tokens of a merged chunk are made bold.
Once the ouput text is anchored the input tokens can be clicked on to view the exact shap value (Hovering over input token also brings up a tooltip with the values). Auto merged tokens show the total values divided over the number of tokens in that chunk.
Hovering over the input text shows the SHAP value for that token for each output token. This is again signified by the background color of the output token. This can be anchored by clicking on the input token.
Note: The color scaling for all token (input and output) are consistent and the brightest red is assigned to the maximum SHAP value of input tokens for any output token.
Note: The layout of the two pieces of text can be changed by using the ‘Layout’ Drop down menu.
[17]:
shap.plots.text(shap_values)
0th instance:
Visualization Type:
Saliency Plot
x-axis: Output Text
y-axis: Input Text
In this picture
,
there are four persons
: my father ,
my mother ,
my brother and my sister .
En
7.191
0.141
0.137
0.122
-0.064
-0.055
0.0
este
1.878
-0.031
0.48
0.524
0.106
-0.279
0.0
cuadro
7.078
0.146
0.348
0.358
-0.122
-0.202
0.0
,
0.149
1.93
-0.544
-0.293
-0.073
-0.118
0.0
hay
-0.434
0.101
6.947
-0.51
-0.341
-0.165
0.0
cuatro
-0.624
0.201
7.434
0.106
-0.099
0.081
0.0
personas
0.017
0.128
5.455
0.033
0.009
0.088
0.0
:
0.349
0.37
1.496
2.519
0.02
0.197
0.0
mi
0.504
-0.074
0.358
5.669
2.105
2.861
0.0
padre
-0.253
-0.034
-0.179
6.934
-0.832
-0.823
0.0
,
0.259
0.123
0.293
1.729
1.075
0.42
0.0
mi
-0.102
-0.309
-0.387
-1.664
3.499
2.038
0.0
madre
-0.222
-0.01
-0.87
0.979
5.393
-1.941
0.0
,
0.023
0.115
0.036
0.371
1.394
0.802
0.0
mi
-0.085
-0.037
-0.454
-0.857
-0.624
4.571
0.0
hermano
-0.131
-0.015
0.094
-0.173
0.159
5.536
0.0
y
0.128
0.106
0.057
0.138
0.377
3.904
0.0
mi
-0.067
0.017
-0.121
-0.174
-0.026
2.961
0.0
hermana
-0.03
-0.036
-0.119
0.093
0.229
5.962
0.0
.
0.059
-0.066
-0.011
-0.15
-0.006
2.303
0.0
Input/Output - Heatmap
Layout :
Input Text
In
this
picture
,
there
are
four
persons
:
my
father
,
my
mother
,
my
brother
and
my
sister
.
Output Text
En
este
cuadro
,
hay
cuatro
personas
:
mi
padre
,
mi
madre
,
mi
hermano
y
mi
hermana
.
Have an idea for more helpful examples? Pull requests that add to this documentation notebook are encouraged!