Image Data Explanation Benchmarking: Image Multiclass Classification
This notebook demonstrates how to use the benchmark utility to benchmark the performance of an explainer for image data. In this demo, we showcase explanation performance for partition explainer on an Image Multiclass Classification model. The metrics used to evaluate are “keep positive” and “keep negative”. The masker used is Image Masker with Inpaint Telea.
The new benchmark utility uses the new API with MaskedModel as wrapper around user-imported model and evaluates masked values of inputs.
[1]:
import json

import numpy as np
from tensorflow.keras.applications.resnet50 import ResNet50, preprocess_input

import shap
import shap.benchmark as benchmark
Load Data and Model
[2]:
model = ResNet50(weights="imagenet")
X, y = shap.datasets.imagenet50()
Class Label Mapping
[3]:
url = "https://s3.amazonaws.com/deep-learning-models/image-models/imagenet_class_index.json"
with open(shap.datasets.cache(url)) as file:
    class_names = [v[1] for v in json.load(file).values()]
Define Score Function
[4]:
def f(x):
    tmp = x.copy()
    if len(tmp.shape) == 2:
        tmp = tmp.reshape(tmp.shape[0], *X[0].shape)
    preprocess_input(tmp)
    return model(tmp)
Define Image Masker
[5]:
masker = shap.maskers.Image("inpaint_telea", X[0].shape)
Create Explainer Object
[6]:
explainer = shap.Explainer(f, masker, output_names=class_names)
explainers.Partition is still in an alpha state, so use with caution...
Run SHAP Explanation
[7]:
shap_values = explainer(X[1:3], max_evals=500, batch_size=50, outputs=shap.Explanation.argsort.flip[:4])
Partition explainer: 50%|█████████████████ | 1/2 [00:00<?, ?it/s]
Partition explainer: 3it [03:15, 65.24s/it]
Plot SHAP Explanation
[8]:
shap.image_plot(shap_values)

Get Output Class Indices
[9]:
output = f(X[1:3]).numpy()
num_of_outputs = 4
sorted_indexes = np.argsort(-output, axis=1)
sliced_indexes = np.array([index_list[:num_of_outputs] for index_list in sorted_indexes])
Define Metrics (Sort Order & Perturbation Method)
[10]:
sort_order = "positive"
perturbation = "keep"
Benchmark Explainer
[11]:
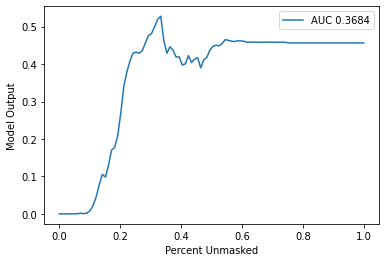
sequential_perturbation = benchmark.perturbation.SequentialPerturbation(
    explainer.model, explainer.masker, sort_order, perturbation
)
xs, ys, auc = sequential_perturbation.model_score(shap_values, X[1:2], indices=sliced_indexes[0])
sequential_perturbation.plot(xs, ys, auc)