Tabular Data Explanation Benchmarking: Xgboost Regression
This notebook demonstrates how to use the benchmark utility to benchmark the performance of an explainer for tabular data. In this demo, we showcase explanation performance for TreeExplainer. The metrics used to evaluate are “keep positive” and “keep negative”. The masker used here is IndependentMasker but can also generalize to other tabular maskers.
The new benchmark utility uses the new API with MaskedModel as wrapper around user-imported model and evaluates masked values of inputs.
[1]:
import xgboost
from sklearn.model_selection import train_test_split

import shap
import shap.benchmark as benchmark
Load Data and Model
[2]:
# create trained model for prediction function
untrained_model = xgboost.XGBRegressor(n_estimators=100, subsample=0.3)
X, y = shap.datasets.california()
X = X.values

test_size = 0.3
random_state = 0
X_train, X_test, y_train, y_test = train_test_split(X, y, test_size=test_size, random_state=random_state)

model = untrained_model.fit(X_train, y_train)
Define Explainer Masker
[3]:
# use Independent masker as default
masker = shap.maskers.Independent(X)
Create Explainer Object
[4]:
# tree explainer is used
explainer = shap.Explainer(model, masker)
Run SHAP Explanation
[5]:
shap_values = explainer(X)
98%|===================| 20313/20640 [00:38<00:00]
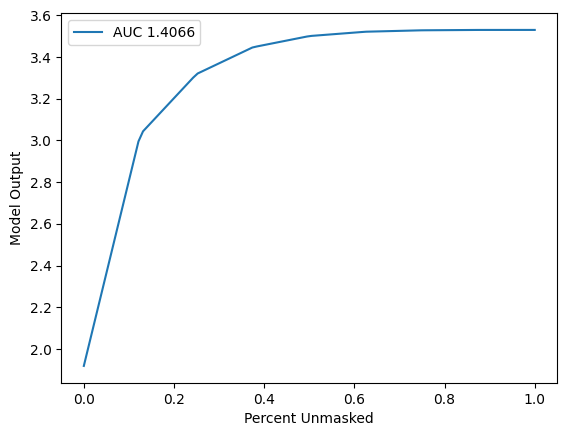
Define Metrics (Sort Order & Perturbation Method)
[6]:
sort_order = "positive"
perturbation = "keep"
Benchmark Explainer
[7]:
sp = benchmark._sequential.SequentialPerturbation(explainer.model, explainer.masker, sort_order, perturbation)
sp_result = sp("SequentialPerturbation", shap_values.values, X)
sp.plot(sp_result.curve_x, sp_result.curve_y, sp_result.value)
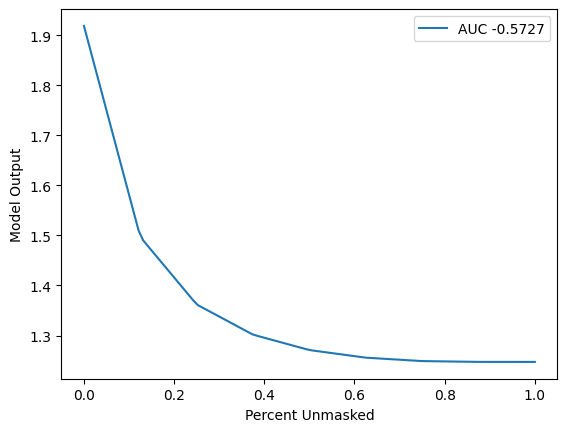
[8]:
sort_order = "negative"
perturbation = "keep"
[9]:
sp = benchmark._sequential.SequentialPerturbation(explainer.model, explainer.masker, sort_order, perturbation)
sp_result = sp("SequentialPerturbation", shap_values.values, X)
sp.plot(sp_result.curve_x, sp_result.curve_y, sp_result.value)