Front page example (XGBoost)
The code from the front page example using XGBoost.
[1]:
import xgboost
import shap
# train an XGBoost model
X, y = shap.datasets.california()
model = xgboost.XGBRegressor().fit(X, y)
# explain the model's predictions using SHAP
# (same syntax works for LightGBM, CatBoost, scikit-learn, transformers, Spark, etc.)
explainer = shap.Explainer(model)
shap_values = explainer(X)
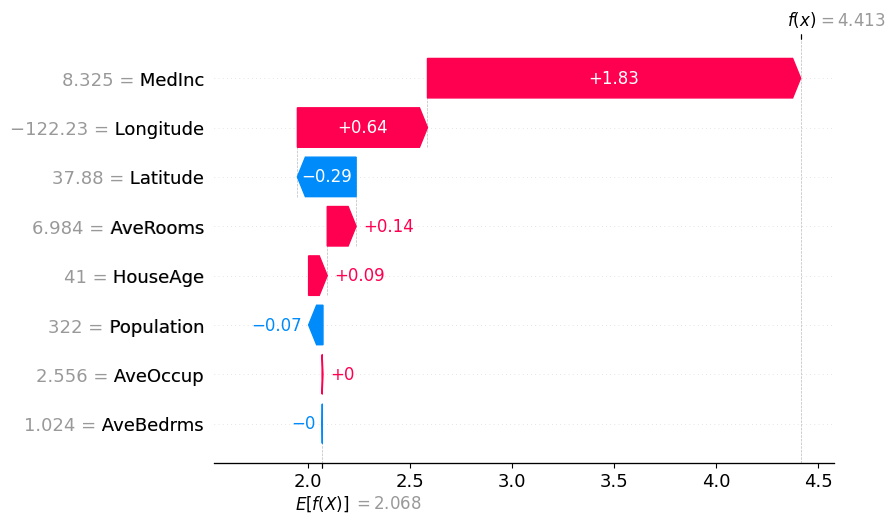
# visualize the first prediction's explanation
shap.plots.waterfall(shap_values[0])
is_sparse is deprecated and will be removed in a future version. Check `isinstance(dtype, pd.SparseDtype)` instead.
is_categorical_dtype is deprecated and will be removed in a future version. Use isinstance(dtype, CategoricalDtype) instead
is_categorical_dtype is deprecated and will be removed in a future version. Use isinstance(dtype, CategoricalDtype) instead
is_categorical_dtype is deprecated and will be removed in a future version. Use isinstance(dtype, CategoricalDtype) instead
[2]:
shap.plots.initjs()

[3]:
# visualize the first prediction's explanation with a force plot
shap.plots.force(shap_values[0])
[3]:
Visualization omitted, Javascript library not loaded!
Have you run `initjs()` in this notebook? If this notebook was from another user you must also trust this notebook (File -> Trust notebook). If you are viewing this notebook on github the Javascript has been stripped for security. If you are using JupyterLab this error is because a JupyterLab extension has not yet been written.
Have you run `initjs()` in this notebook? If this notebook was from another user you must also trust this notebook (File -> Trust notebook). If you are viewing this notebook on github the Javascript has been stripped for security. If you are using JupyterLab this error is because a JupyterLab extension has not yet been written.
[4]:
# visualize all the training set predictions
shap.plots.force(shap_values[:500])
[4]:
Visualization omitted, Javascript library not loaded!
Have you run `initjs()` in this notebook? If this notebook was from another user you must also trust this notebook (File -> Trust notebook). If you are viewing this notebook on github the Javascript has been stripped for security. If you are using JupyterLab this error is because a JupyterLab extension has not yet been written.
Have you run `initjs()` in this notebook? If this notebook was from another user you must also trust this notebook (File -> Trust notebook). If you are viewing this notebook on github the Javascript has been stripped for security. If you are using JupyterLab this error is because a JupyterLab extension has not yet been written.
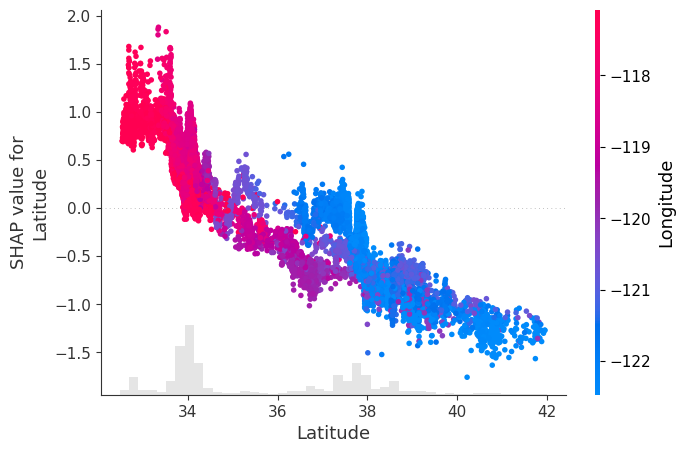
[5]:
# create a dependence scatter plot to show the effect of a single feature across the whole dataset
shap.plots.scatter(shap_values[:, "Latitude"], color=shap_values)

[6]:
# create a dependence scatter plot to show the effect of a single feature across the whole dataset
shap.plots.scatter(shap_values[:, "Latitude"], color=shap_values)
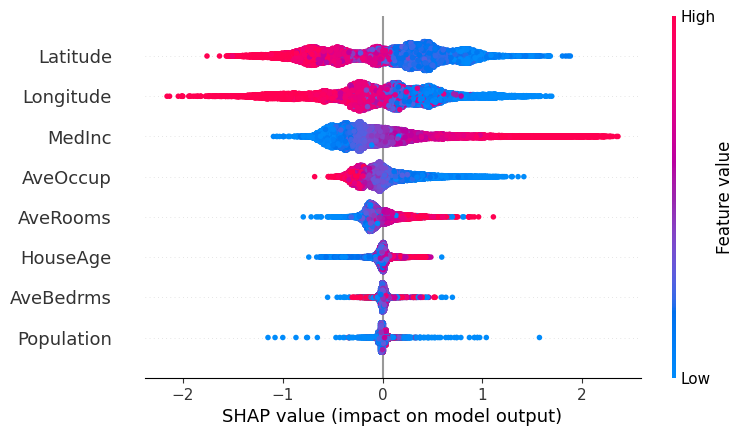
[7]:
# summarize the effects of all the features
shap.plots.beeswarm(shap_values)
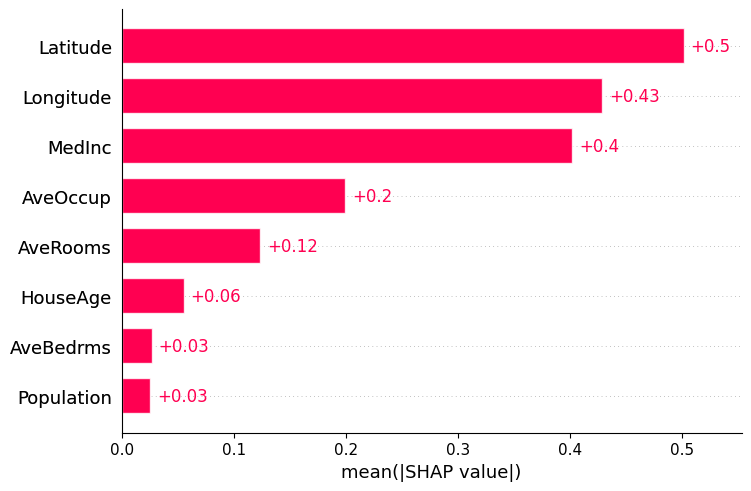
[8]:
shap.plots.bar(shap_values)