Diabetes regression with scikit-learn
This uses the model-agnostic KernelExplainer and the TreeExplainer to explain several different regression models trained on a small diabetes dataset. This notebook is meant to give examples of how to use KernelExplainer for various models.
Load data
[1]:
import time

import numpy as np
from sklearn.model_selection import train_test_split

import shap

X, y = shap.datasets.diabetes()
X_train, X_test, y_train, y_test = train_test_split(X, y, test_size=0.2, random_state=0)

# rather than use the whole training set to estimate expected values, we summarize with
# a set of weighted kmeans, each weighted by the number of points they represent.
X_train_summary = shap.kmeans(X_train, 10)


def print_accuracy(f):
    print(f"Root mean squared test error = {np.sqrt(np.mean((f(X_test) - y_test) ** 2))}")
    time.sleep(0.5)  # to let the print get out before any progress bars


shap.initjs()

Linear regression
[2]:
from sklearn import linear_model

lin_regr = linear_model.LinearRegression()
lin_regr.fit(X_train, y_train)

print_accuracy(lin_regr.predict)
Root mean squared test error = 58.51766133582009
Explain a single prediction from the test set
[3]:
ex = shap.KernelExplainer(lin_regr.predict, X_train_summary)
shap_values = ex.shap_values(X_test.iloc[0, :])
shap.force_plot(ex.expected_value, shap_values, X_test.iloc[0, :])
[3]:
Visualization omitted, Javascript library not loaded!
Have you run `initjs()` in this notebook? If this notebook was from another user you must also trust this notebook (File -> Trust notebook). If you are viewing this notebook on github the Javascript has been stripped for security.
Have you run `initjs()` in this notebook? If this notebook was from another user you must also trust this notebook (File -> Trust notebook). If you are viewing this notebook on github the Javascript has been stripped for security.
Explain all the predictions in the test set
[4]:
shap_values = ex.shap_values(X_test)
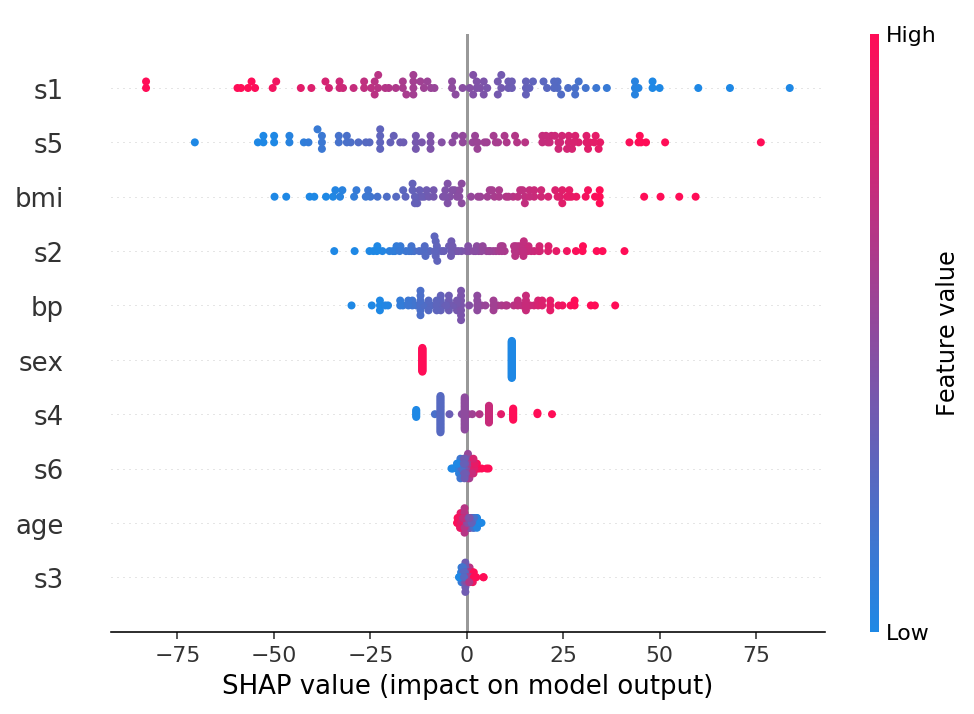
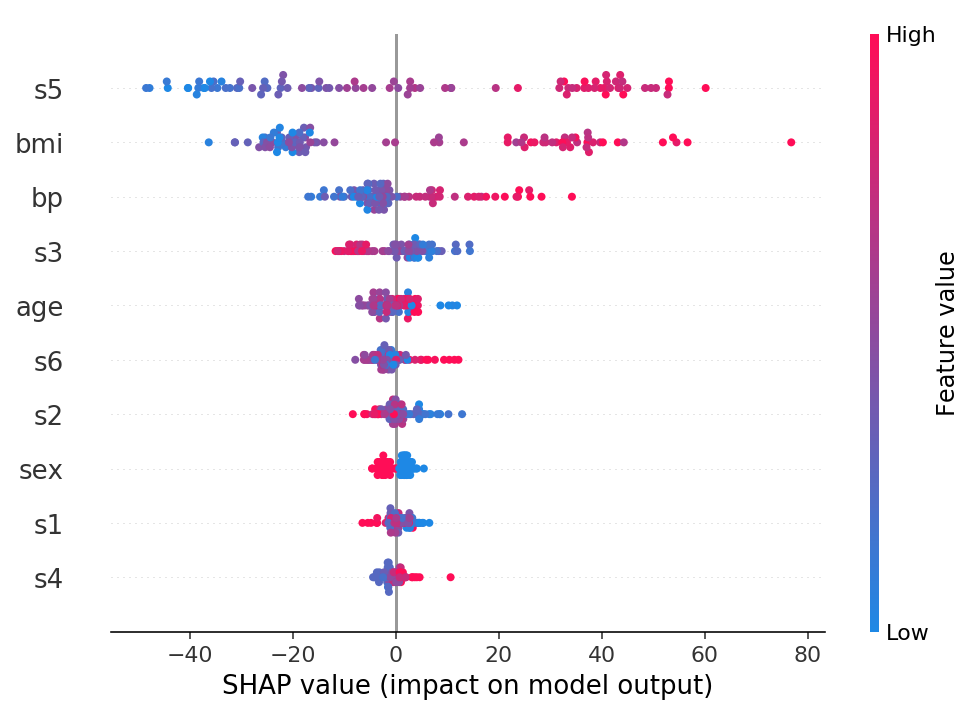
shap.summary_plot(shap_values, X_test)
100%|██████████| 89/89 [00:21<00:00, 4.16it/s]
[5]:
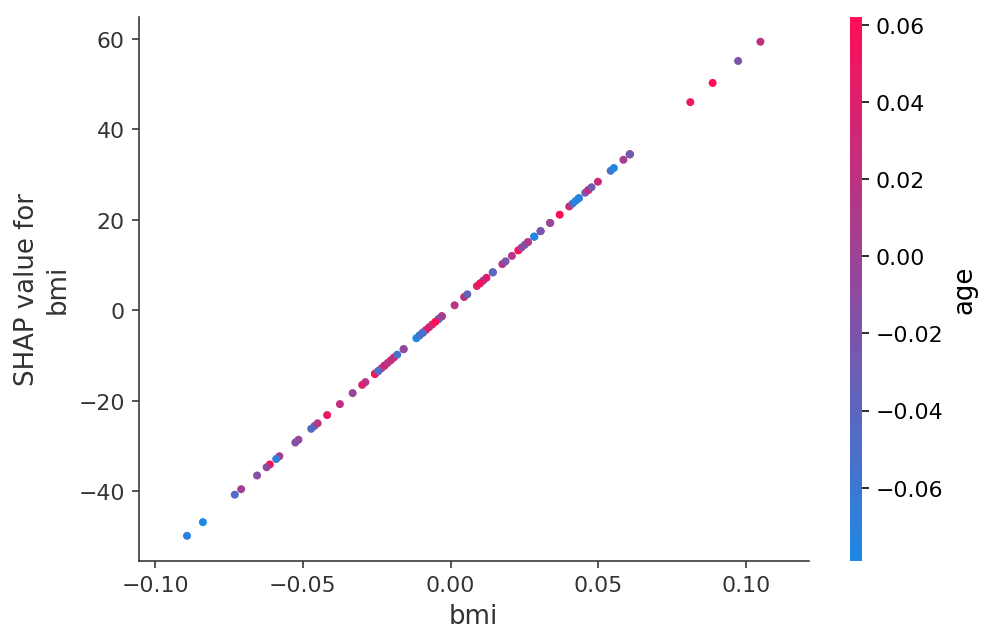
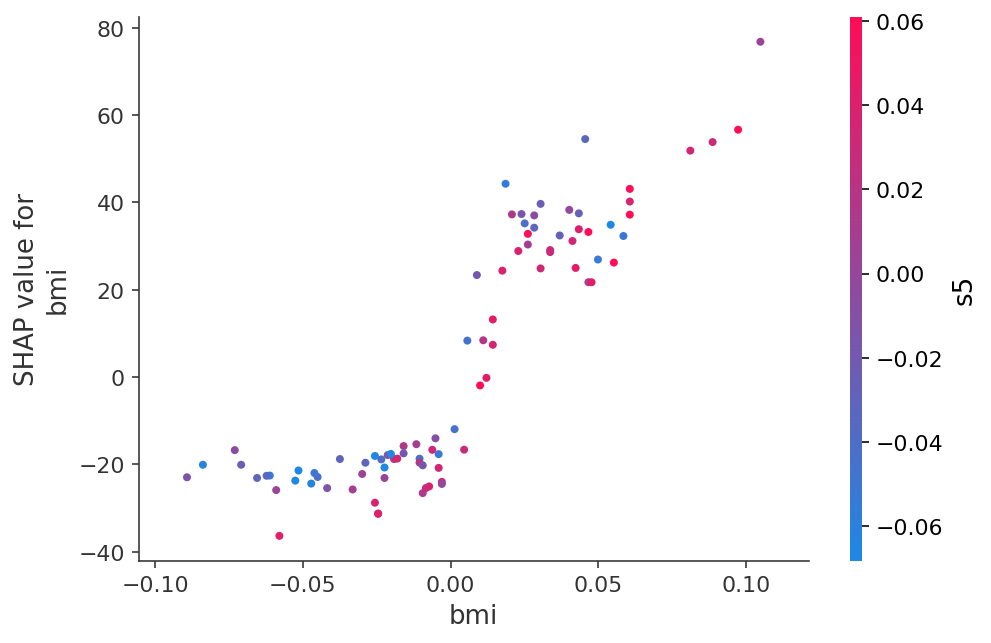
shap.dependence_plot("bmi", shap_values, X_test)
[6]:
shap.force_plot(ex.expected_value, shap_values, X_test)
[6]:
Visualization omitted, Javascript library not loaded!
Have you run `initjs()` in this notebook? If this notebook was from another user you must also trust this notebook (File -> Trust notebook). If you are viewing this notebook on github the Javascript has been stripped for security.
Have you run `initjs()` in this notebook? If this notebook was from another user you must also trust this notebook (File -> Trust notebook). If you are viewing this notebook on github the Javascript has been stripped for security.
Decision tree regressor
[7]:
from sklearn import tree
dtree = tree.DecisionTreeRegressor(min_samples_split=20)
dtree.fit(X_train, y_train)
print_accuracy(dtree.predict)
# explain all the predictions in the test set
ex = shap.TreeExplainer(dtree)
shap_values = ex.shap_values(X_test)
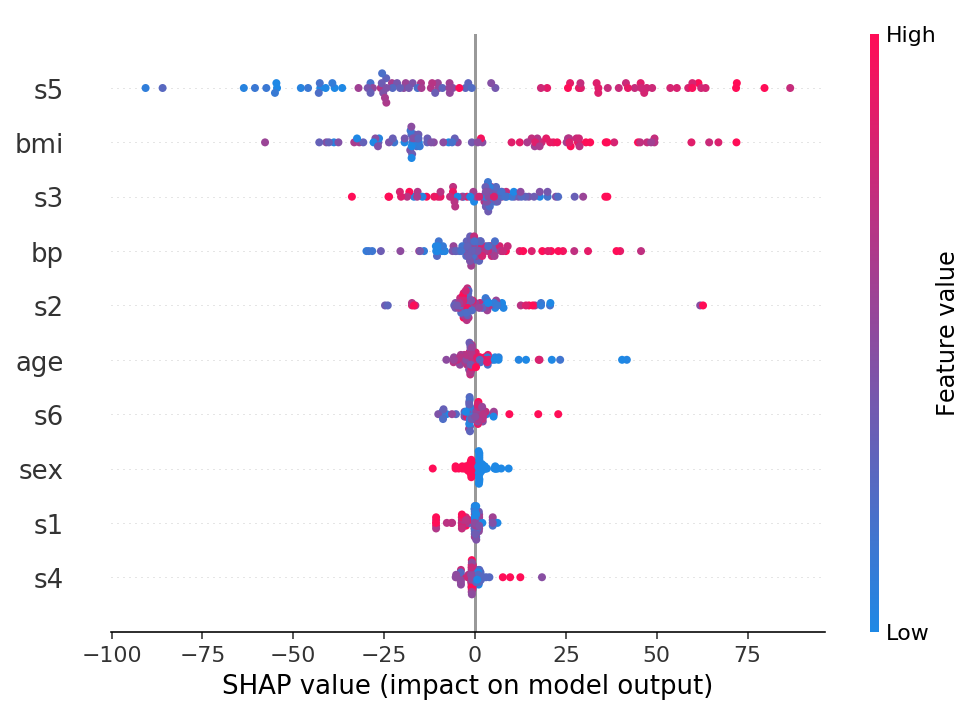
shap.summary_plot(shap_values, X_test)
Root mean squared test error = 71.98699151013147
[8]:
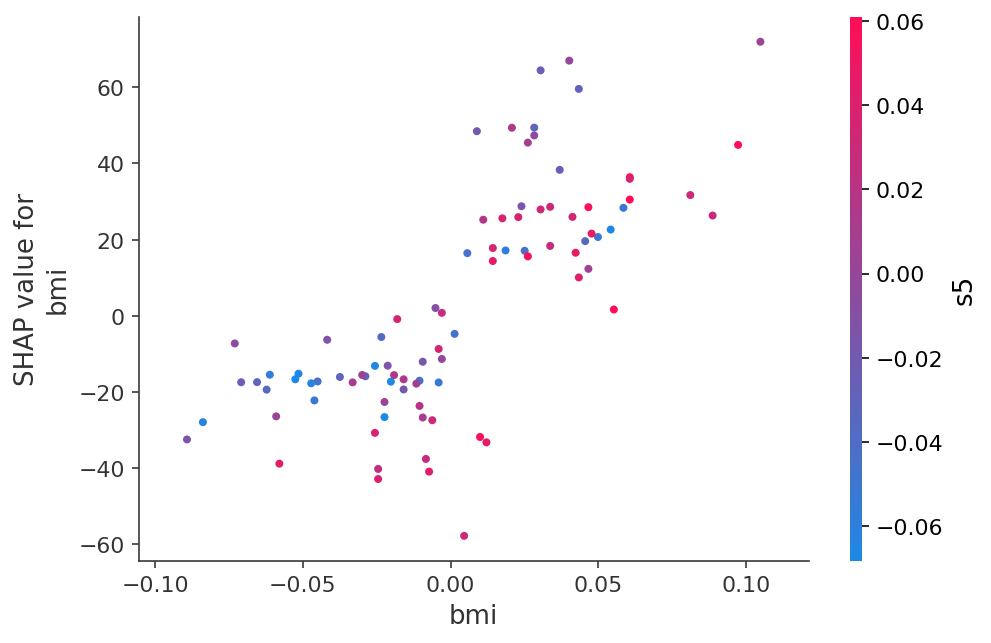
shap.dependence_plot("bmi", shap_values, X_test)
[9]:
shap.force_plot(ex.expected_value, shap_values, X_test)
[9]:
Visualization omitted, Javascript library not loaded!
Have you run `initjs()` in this notebook? If this notebook was from another user you must also trust this notebook (File -> Trust notebook). If you are viewing this notebook on github the Javascript has been stripped for security.
Have you run `initjs()` in this notebook? If this notebook was from another user you must also trust this notebook (File -> Trust notebook). If you are viewing this notebook on github the Javascript has been stripped for security.
Random forest
Using the fast TreeExplainer implementation.
[10]:
from sklearn.ensemble import RandomForestRegressor

rforest = RandomForestRegressor(n_estimators=1000, max_depth=None, min_samples_split=2, random_state=0)
rforest.fit(X_train, y_train)
print_accuracy(rforest.predict)

# explain all the predictions in the test set
explainer = shap.TreeExplainer(rforest)
shap_values = explainer.shap_values(X_test)
shap.summary_plot(shap_values, X_test)
Root mean squared test error = 61.24795842972228
[11]:
shap.dependence_plot("bmi", shap_values, X_test)
[12]:
shap.force_plot(explainer.expected_value, shap_values, X_test)
[12]:
Visualization omitted, Javascript library not loaded!
Have you run `initjs()` in this notebook? If this notebook was from another user you must also trust this notebook (File -> Trust notebook). If you are viewing this notebook on github the Javascript has been stripped for security.
Have you run `initjs()` in this notebook? If this notebook was from another user you must also trust this notebook (File -> Trust notebook). If you are viewing this notebook on github the Javascript has been stripped for security.
Neural network
[13]:
from sklearn.neural_network import MLPRegressor
nn = MLPRegressor(solver="lbfgs", alpha=1e-1, hidden_layer_sizes=(5, 2), random_state=0)
nn.fit(X_train, y_train)
print_accuracy(nn.predict)
# explain all the predictions in the test set
explainer = shap.KernelExplainer(nn.predict, X_train_summary)
shap_values = explainer.shap_values(X_test)
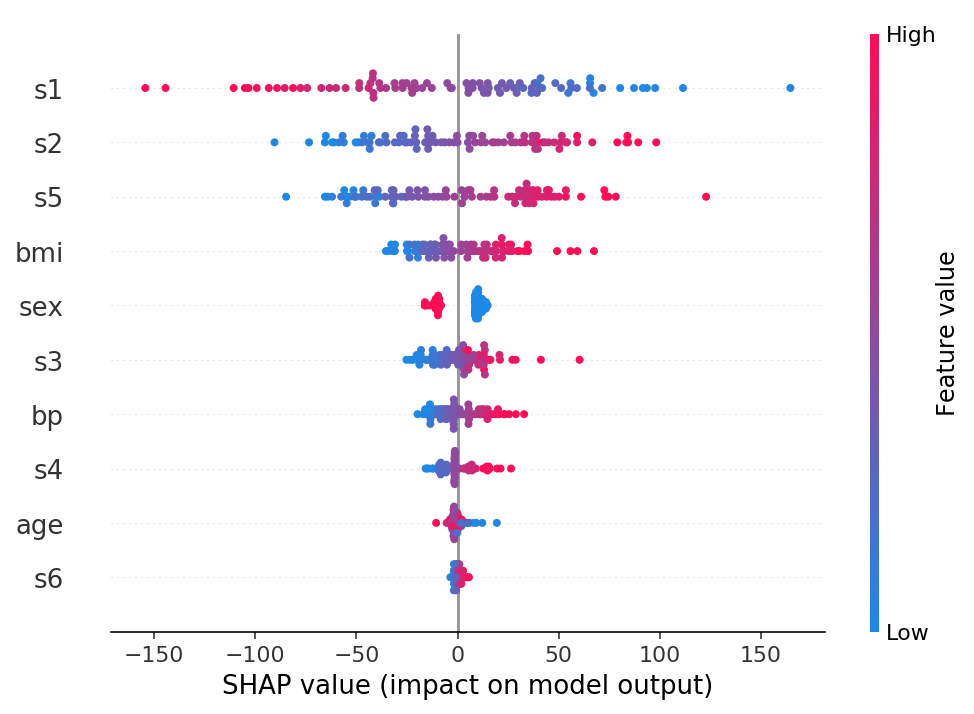
shap.summary_plot(shap_values, X_test)
Root mean squared test error = 58.517105754085364
100%|██████████| 89/89 [00:19<00:00, 4.65it/s]
[14]:
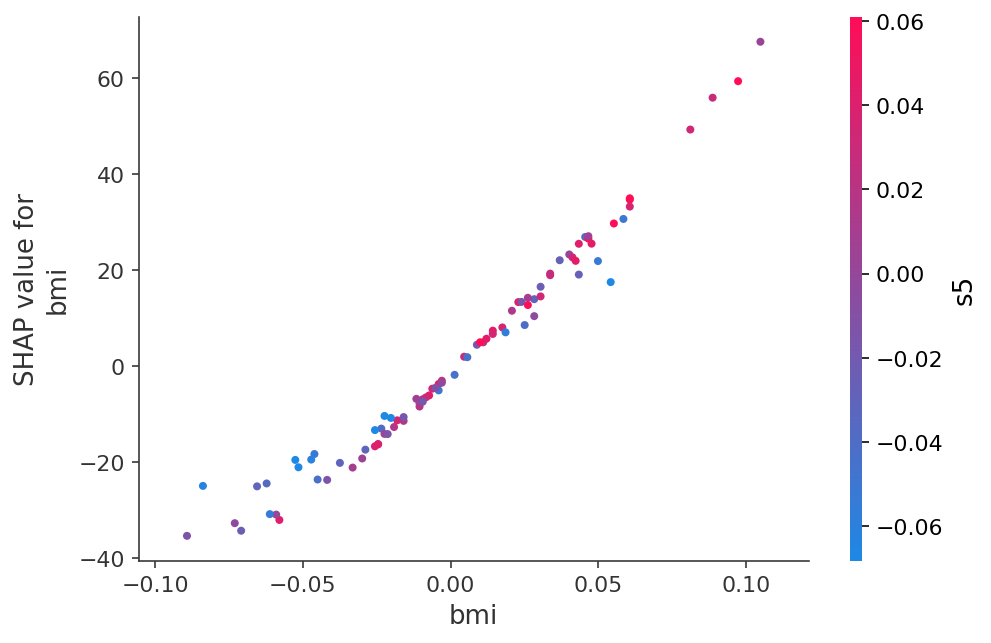
shap.dependence_plot("bmi", shap_values, X_test)
[15]:
shap.force_plot(explainer.expected_value, shap_values, X_test)
[15]:
Visualization omitted, Javascript library not loaded!
Have you run `initjs()` in this notebook? If this notebook was from another user you must also trust this notebook (File -> Trust notebook). If you are viewing this notebook on github the Javascript has been stripped for security.
Have you run `initjs()` in this notebook? If this notebook was from another user you must also trust this notebook (File -> Trust notebook). If you are viewing this notebook on github the Javascript has been stripped for security.